The Brain's Secrets: EEG and Event-Related Potentials (ERPs)
Ever wondered how scientists peek inside the brain to understand how we think, react, and perceive the world around us? One of the coolest tools they use is called Electroencephalography (EEG), and it’s like listening to the brain’s electrical chatter using sensors placed on the scalp.
What is EEG?
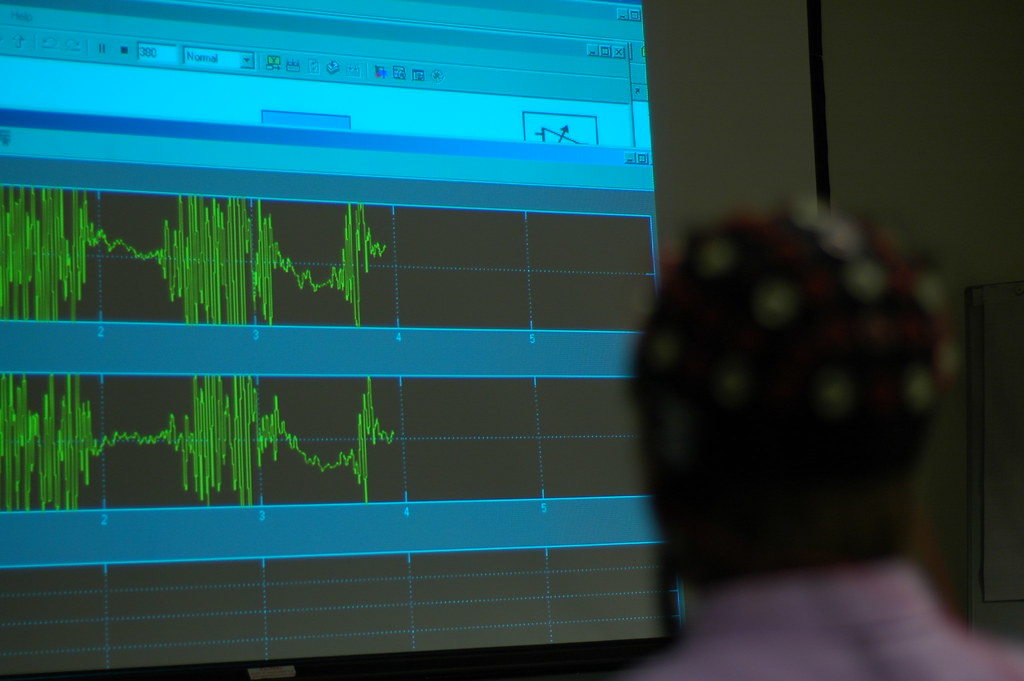
Imagine placing a microphone on the roof of a stadium during a game. You’d pick up the general roar of the crowd – cheers, shouts, and maybe even the announcer. EEG is similar. It uses scalp electrodes to detect the overall electrical activity produced by the billions of neurons firing beneath our skulls. While it might not pinpoint individual “conversations” between neurons with perfect accuracy (low spatial resolution), it gives us a fantastic overview of what’s happening in the brain.
From Brain Waves to Cognitive Insights: Enter ERPs
Initially, EEG was used to study rhythmic brain waves, like alpha waves (when you’re relaxed) or delta waves (when you’re sleeping). But now, researchers often focus on Event-Related Potentials (ERPs). Think of ERPs as the brain’s immediate response to a specific event or stimulus.
Here’s the basic idea:
- Present a Stimulus: Show someone a picture, play a sound, or ask them to perform a task.
- Record Brain Activity: EEG continuously records the brain’s electrical activity.
- Identify the “Event”: Mark the precise moment when the stimulus was presented (e.g., when the picture appeared on the screen).
- Extract “Epochs”: Cut out small segments of the EEG recording around those event markers (-200ms to +1300ms is common).
- The Magic of Averaging: Because raw EEG data is noisy, researchers repeat the stimulus many times and then average the EEG responses. This cancels out random noise and highlights the brain activity that’s consistently linked to the stimulus. This is called signal averaging.
It’s like taking multiple photos of a faint star. Each photo might be blurry, but when you stack them on top of each other, the star becomes clearer!
The Flanker Task
Let’s say you’re participating in a study where you have to press a button to indicate the direction of a central arrow (either left or right). But here’s the catch: the central arrow is flanked by other arrows that might point in the same direction (congruent) or the opposite direction (incongruent). This is the Flanker Task.
ERPs can reveal fascinating insights into how your brain handles this task:
- Stimulus Onset: the begining of the trial whether it be congruent or incongruent
- Response Event: Whether the subject pressed the correct or incorrect button
- Inter-trial Interval: The rest period before the next stimulus
Decoding ERP Components: What the Peaks and Valleys Mean
ERPs aren’t just random squiggles. They consist of distinct peaks and troughs, called components, each reflecting specific brain processes. These components are labeled with a “P” (positive) or “N” (negative) and a number indicating when they occur after the stimulus (in milliseconds).
Here are a few examples:
- N170: This component spikes around 170 milliseconds after seeing a face. It’s much stronger when viewing faces compared to other objects, suggesting the brain has specialized circuits for face recognition.
- P300 (Oddball Response): Imagine you’re shown a series of green dots, and suddenly, a red dot appears. The red dot is unexpected, and your brain will react with a P300 response, indicating surprise or “mismatch.”
- N2 Effect: In the Flanker Task, incongruent trials (where the flanking arrows conflict with the central arrow) often elicit a more negative N2 component than congruent trials (around 275-325 ms after the stimulus). This suggests the brain is working harder to resolve the conflict.
- Error-Related Negativity (ERN): If you make a mistake in the Flanker Task (press the wrong button), your brain generates a distinct negativity (ERN) within milliseconds of the error, showing that it’s processing your mistake in real-time.
- N400 and P600 Components: if you hear “the cat will bake the cookies” you will see this component, because the brain is proccessing sematics and syntax.
Preparing the Data: Cleaning and Refining the Signal
Before we can analyze ERPs, we need to clean up the raw EEG data. Here are some key steps:
- Cleaning the Data: Eye blinks and movements create large artifacts in the EEG. Researchers use techniques like Independent Component Analysis (ICA) to identify and remove these artifacts, giving us cleaner data.
- Filtering the Data: EEG signals contain a mix of frequencies. A bandpass filter (e.g., 0.05 Hz to 15 Hz) removes unwanted high and low frequencies, improving the signal’s clarity.
- Baseline Correction: To make sure all trials start from a common reference point, researchers subtract the average signal from a pre-event baseline period.
Why ERPs Matter: Applications in Neuroscience and Beyond
ERPs offer a powerful way to study cognitive processes with excellent time resolution (we can see changes in brain activity happening within milliseconds!). This makes them invaluable for:
- Understanding Perception, Attention, and Memory: ERPs help us dissect the brain processes involved in these fundamental cognitive functions.
- Clinical Research: ERPs are used to study neurological and psychiatric disorders like schizophrenia, autism, and epilepsy. Differences in ERP patterns can serve as early indicators of these conditions, aiding in diagnosis and treatment.
The Future of Brain Research
EEG and ERP techniques are constantly evolving. Despite EEG’s limits in spatial resolution, advancements in technology and data analysis are making it an increasingly valuable tool for unlocking the brain’s secrets. As we continue to refine these methods, we’ll gain even deeper insights into the complexities of the human mind.